
Exponential Regression Model Example
(when doing an exponential regression, the y-values will be greater than 0)
Exponential Regression Model Example
(when doing an exponential regression, the y-values will be greater than 0)
|
|||||||||||||||||||||||||||||||||||||||||||||||||||||||||
| Important: We will be accumulating all of our pages in one document. We need to keep the list connected to the graph and regressions we will be developing.
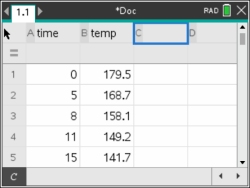
Step 1. Enter the data into the lists. Be sure to NAME the lists.
For basic entry of data, see Lists & Spreadsheets.
If needed, resize the columns to see the names. Use arrows to widen columns, hit |
 |
||||||||||||||||||||||||||||||||||||||||||||||||||||||||
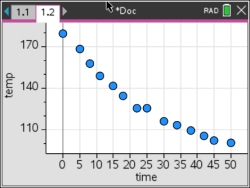
| Step 2 Create a scatter plot of the data. Press Choose: #5 Add Data & Statistics to create a generic plot of the data. Move the cursor so that it hovers over "Click to add variable" at both the bottom and the left side of the screen. Choose time for the x-variable and temp for the y-variable. |
 |
||||||||||||||||||||||||||||||||||||||||||||||||||||||||
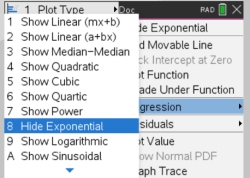
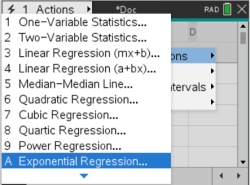
| Step 3. Plot an Exponential Regression Model. Choose
|
 |
||||||||||||||||||||||||||||||||||||||||||||||||||||||||
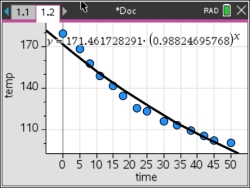
Step 4. The graph of the Exponential Regression model appears.
Regression Equation: |
 |
||||||||||||||||||||||||||||||||||||||||||||||||||||||||
Step 5. Get statistical information. Press document tab 1.1, to return to the Lists & Spreadsheet. Press |
 |
||||||||||||||||||||||||||||||||||||||||||||||||||||||||
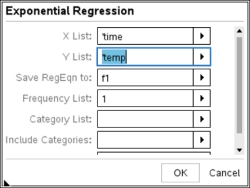
| Step 6. Choose X list: time Choose Y list: temp Save RegEqn to: f1 |
 |
||||||||||||||||||||||||||||||||||||||||||||||||||||||||
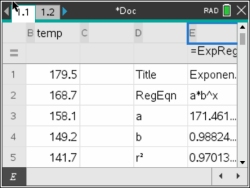
| Step 7. The statistical information will appear in Columns C and D. If you arrow down you will see the r value and the Residuals.
|
 |
||||||||||||||||||||||||||||||||||||||||||||||||||||||||
Step 8. Is this model a "good fit"? The correlation coefficient, r, is -.984956 which places the correlation into the "strong" category. (0.8 or greater is a "strong" correlation) The coefficient of determination, r2, is .970138 which means that 97% of the total variation in y can be explained by the relationship between x and y. Yes, it is a very "good fit". (answer to part c) |
 |
||||||||||||||||||||||||||||||||||||||||||||||||||||||||
Step 9. Based upon the new equation, what was the initial temperature of the coffee? The exponential regression equation is where x stands for time (answer to part d) |
|||||||||||||||||||||||||||||||||||||||||||||||||||||||||
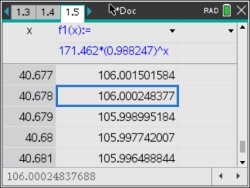
Step 10. Interpolate: (within the data set) When is the coffee at a temperature of 106 degrees? You can graph the function and check intersection with a y-value of 106. If you stored your regression formal in f1(x), it may already be listed under f1(x). |
 |
||||||||||||||||||||||||||||||||||||||||||||||||||||||||
Other option: You can also investigate the TABLE of the graph.
Look through the table to get an idea of approximately where the 106 temperature may occur. To move from one split screen to a full screen graph and a full screen table, hit It is around a time of 40. |
 |
||||||||||||||||||||||||||||||||||||||||||||||||||||||||
To change table settings to get a more accurate reading, choose Start the table at 40 and set delta table to .001, to find a more explicit answer. 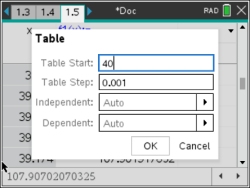 (answer to part e -- after 40.678 minutes) |
 |
||||||||||||||||||||||||||||||||||||||||||||||||||||||||
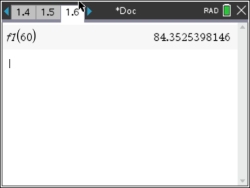
| Step 11. Extrapolate data: (beyond the data set) What is the predicted temperature of the coffee after 1 hour? Press Under the Find f1(60). Do not type "f" from the alphabetic key pad area. (answer to part f -- 84.3522º F) |
 |
||||||||||||||||||||||||||||||||||||||||||||||||||||||||
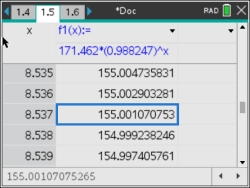
Step 12. How long should the restaurants wait (after pouring the coffee from the pot) before serving coffee, to ensure that the coffee is not hotter than 155º ?
You can go back to the TABLE from Step 10. Reset the Function Table settings. (answer to part g -- approx. 8.5 minutes) |
 |
||||||||||||||||||||||||||||||||||||||||||||||||||||||||
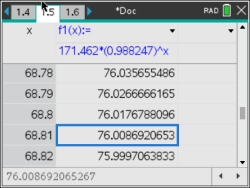
Step 13. If the temperature in the room is 76° F, what will happen to the temperature of the coffee, after being poured from the pot, over an extended period of time?
The adjusted table shows that the coffee will reach room temperature after 68.8 minutes. |
q
|
||||||||||||||||||||||||||||||||||||||||||||||||||||||||
The calculator's exponential equation shows that the coffee will reach room temperature after 68.8 minutes. This exponential graph is asymptotic to the x-axis, implying that the y-values (degrees) approach zero. This can be seen by observing successively larger values substituted into the calculator's exponential equation.
Even though the graph approaches zero asymptotically, we know that the temperature of the coffee will stop cooling once it reaches room temperature of 76º, and will not continue following the curve of this graph.
NOTE: The temperature of the coffee stops cooling when it reaches the room temperature of 76°. The existence of the room temperature will actually affect the final exponential equation. Instead of the graph being asymptotic to the x-axis, the graph is actually asymptotic to the room temperature at y = 76º. This "new" graph will not be exactly the same as the graph we have been examining, as there are changes to the equation. You can see how room temperature affects the graph and the equation for this problem at Newton's Law of Cooling. |
|||||||||||||||||||||||||||||||||||||||||||||||||||||||||
![]()
Table of Contents | MathBits.com | Terms of Use

